Unified’s Portal has added a new component to its Portfolio analysis tab that allows companies to be compared in terms of accelerated or decelerated innovation based on CPC codes.
Innovation Velocity uses two key metrics: ▲ Velocity - the total sum of patents per class code within the last 10 years; and ▲% Velocity - the percentage of change over a given time period. The Innovation Velocity formula is:
The Final Number of Patents specifically looks at years 2017-2022, while the Initial Number of Patents looks at years 2012-2022. By using these parameters, the tool is able to overcome the natural “dark period” of time within the U.S. patenting process. The dark period refers to the 18 months from which an application is filed to the day it is published. These 18 months make it extremely difficult to understand a portfolio’s trajectory because naturally there will be a decline in publicly available application/patent information. By using the formula, the most recent years are aggregated together to get a holistic view of the number of patents over a given time period and measured against the previous years. This provides a glimpse to either the growth or the decline in a specific classification code.
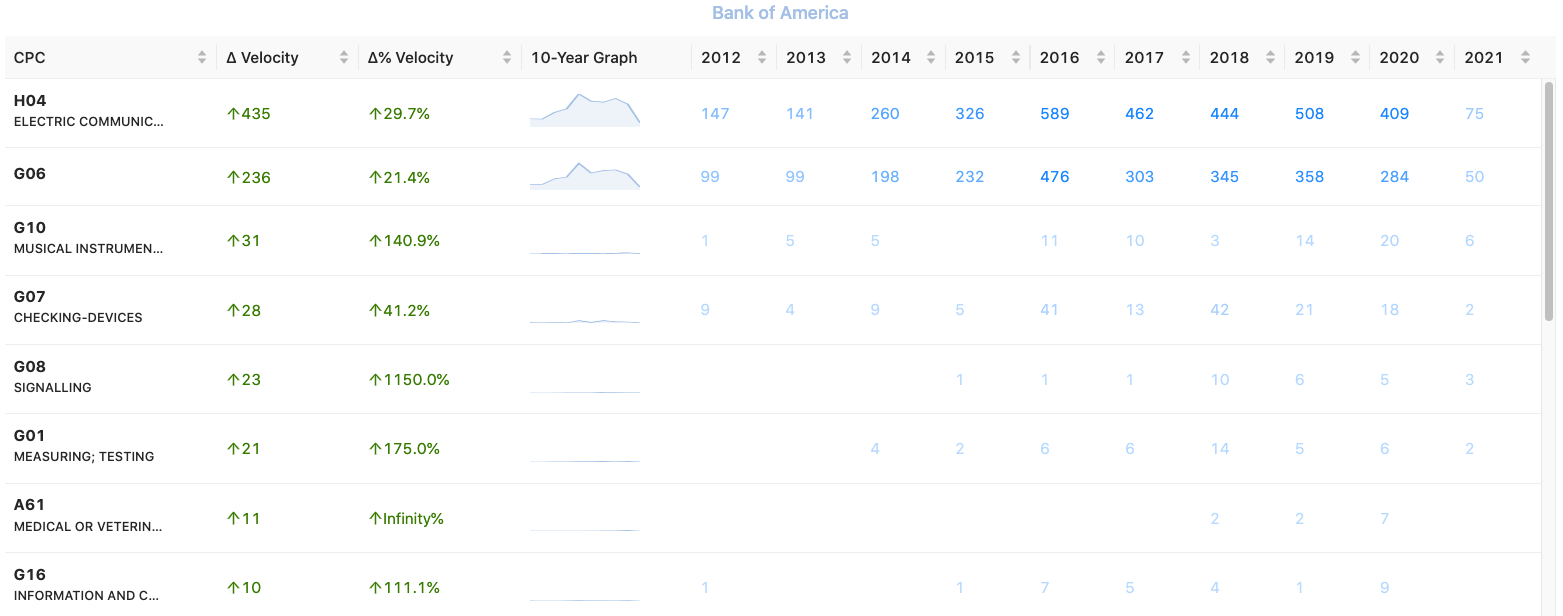
As an example, we can compare Bank of America’s portfolio against JP Morgan Chase in terms of patenting trends, The Innovation Velocity tool allows users to see the general patenting trends for the top CPC codes, with the total being aggregated. Included are the CPC, ▲ Velocity, ▲% Velocity and a ten year graph to show the general trend.
Users then can see the number of patents granted, within each CPC, on the timeline over a specific time period. The patent count is hyperlinked back to Portal’s Patent Search where more analysis could be done on the set of patents.
Users can also view the macro trends of a company, but looking at all the top CPCs and see an aggregate total for the entire company.
Since CPCs tend to be generic and broad, Unified’s Portal provides the same analysis on the CPC Subclass.
Innovation Velocity not only helps companies understand their specific portfolio, but this tool allows users to compare their portfolio with others to understand both the macro and micro trends of their patenting strategy.


